Graphics & vis applications struggle when attempting to maintain real-time interactivity when dealing with large or sensitive datasets. For example, if you have financial data, it is unwise to trust a client application with this data. Thankfully, sensitive data can often be transformed to obfuscate it. For example, instead of visuzalizing raw data, we can visualize a 3D model. However, this does not address the challenge of large data.
The Rendering-as-a-Service architecture addresses this by offloading the visualzation/rendering effort from a client machine to somewhere else. An effective method we found for this was to have a stateless server instance that would accept an http request containing enough information to render a frame.
There are obvious drawbacks to this. One is doing anything real-time will be a challenge due to network latency being included for each frame rendered. An effective way we found to address this was to use several rendering server daemons rather than just 1. We can then tile the rendering surface on the client to N tiles, and then send N requests (1 for each tile). This can take rendering a frame of 1920 by 1080 pixel frame down to 480px by 270px tiles, drastically improving rendering time.
We still have the challenge of managing which daemon each rendering request goes to. To leverage the power of many cloud platforms, we would prefer a system that allows for easy scaling in terms of number of daemons. We found Docker to be a helpful tool here when using its Swarm capabilities.
For the graphics implementation, we used Intel's OSPRay which is part of their RenderKIT. OSPRay is a software renderer with built-in tooling for level-of-detail rendering. This was very useful when rending the entire globe as seen on the right. This LOD optimization is perfect for large-data geometry, and a raytracer is perfect for scientific visualization. We created a Python wrapper around OSPRay's C API, and using FastAPI we were able to easily create the server daemons to handle the rendering requests.
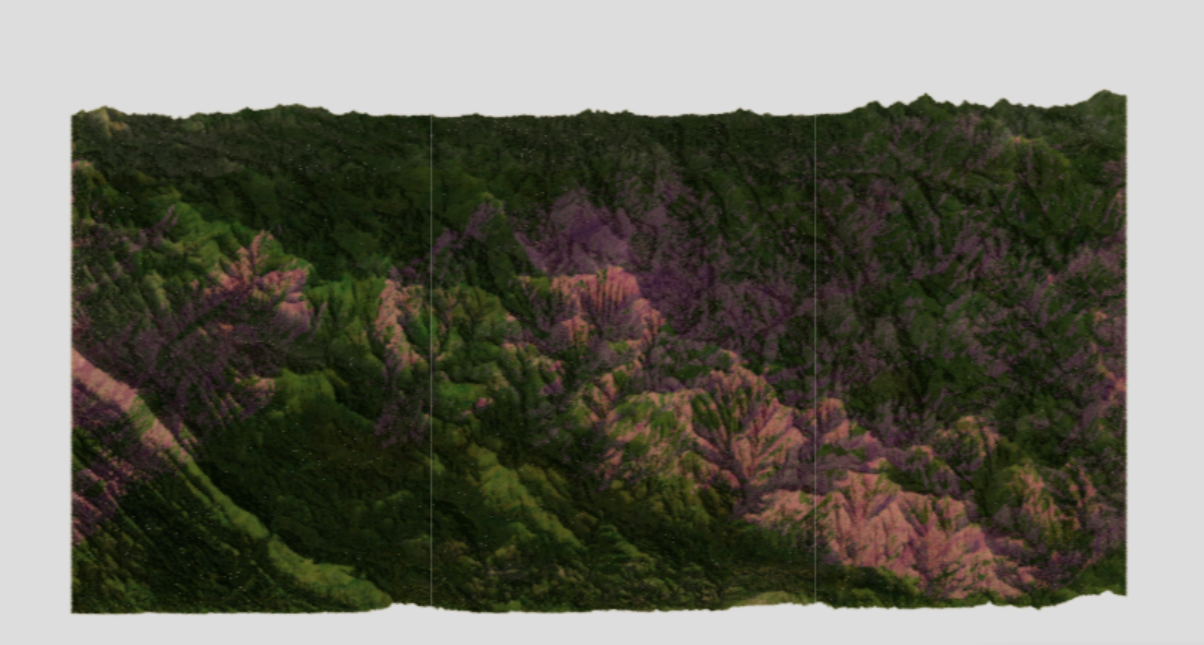
High fidelity Smoky Mountain National Park terrain geometry rendered. To 10-meter scale. Pink coloration is species density data visualized.
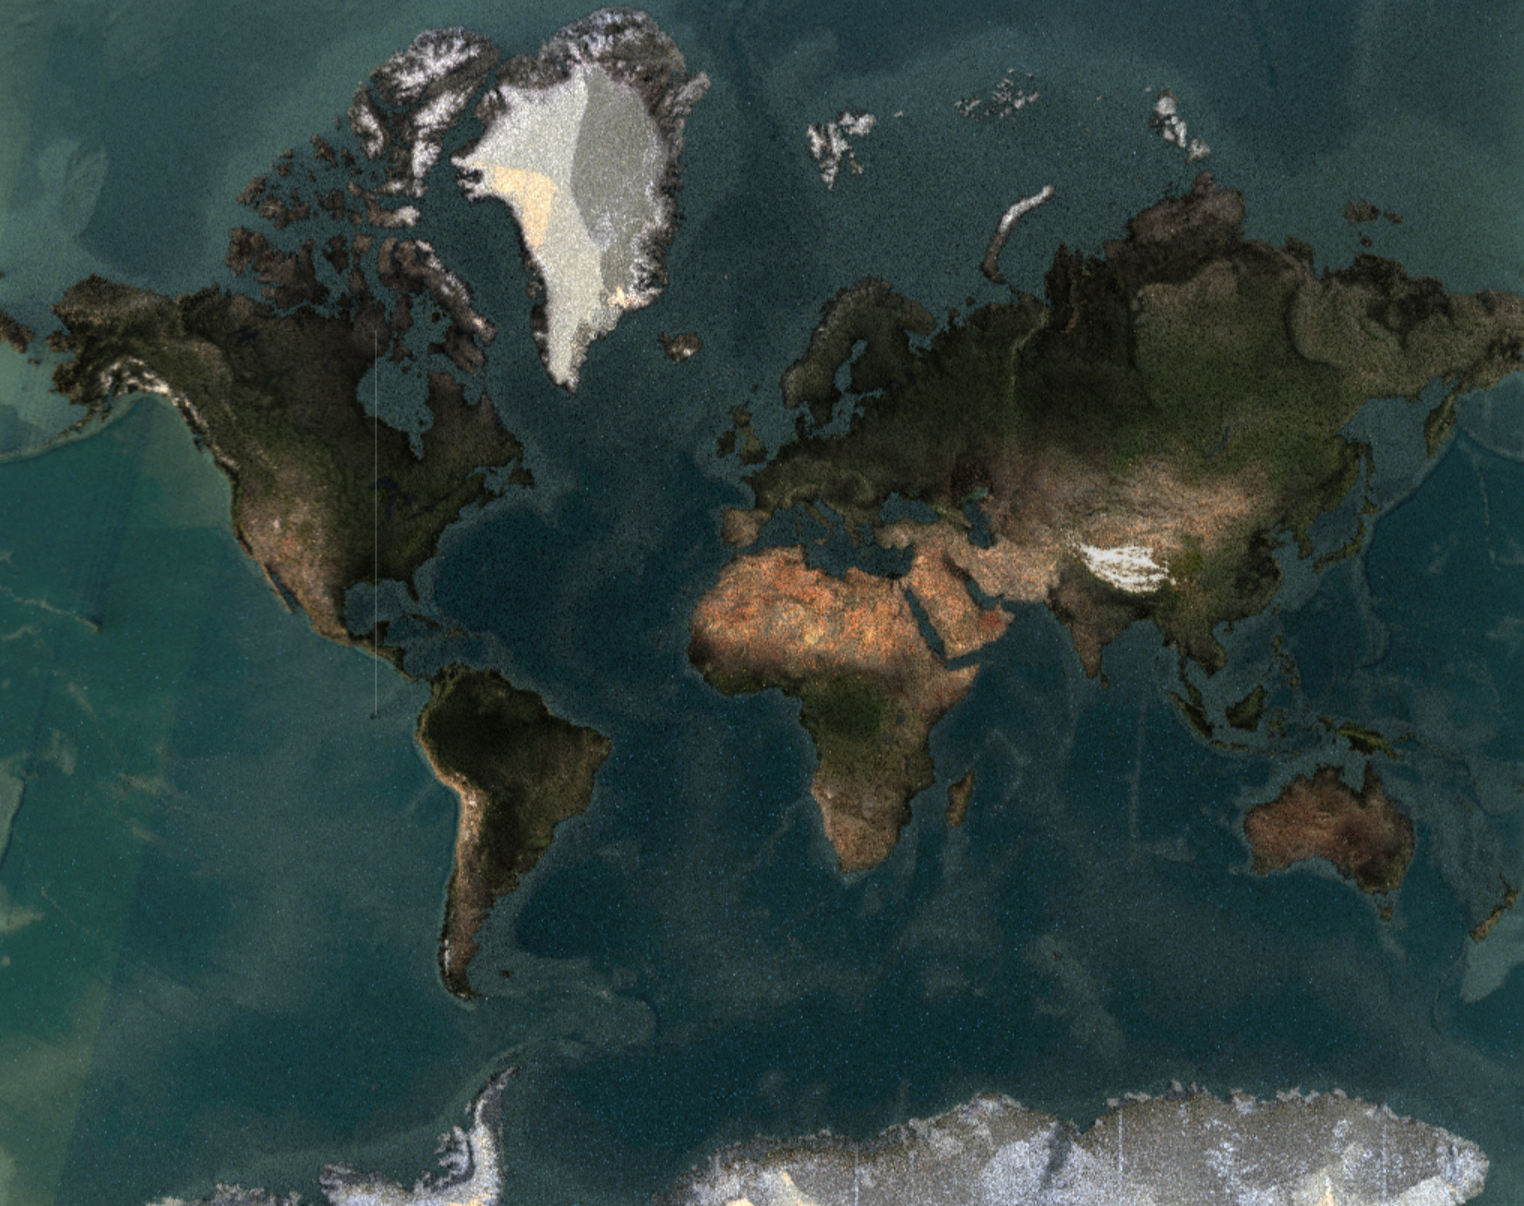
Geometry of entire globe. To 1000-meter scale.